Showing posts with label Mechanical Engineering Job Market. Show all posts

March 15, 2026

Reason #74: Outside the Clusters, You Don't Exist

You type your city into a job board and filter for mechanical engineering. Three results come back. One is HVAC service. One is a six-month contract an hour and a half away. One was posted nine weeks ago and the listing has not been updated since. You refine the search. You widen the radius. You check a second board. The results do not improve. You are not in a bad market. You are in no market at all.

There are roughly 281,000 mechanical engineering jobs in the United States (Bureau of Labor Statistics [BLS], 2024a). See Reason #34. More than half of them are in ten states. Michigan alone holds over 32,000. The Detroit metro area employs more than 20,000 mechanical engineers, one for every hundred workers in the region. Washington, D.C., the capital of the country, employs roughly 500 (BLS, 2024b). New York City, the largest labor market in the nation, has a mechanical engineering location quotient of 0.29 (BLS, 2024a). That means for every mechanical engineer you would expect to find based on national averages, New York has fewer than one in three. You are not scarce there. You are a rounding error.
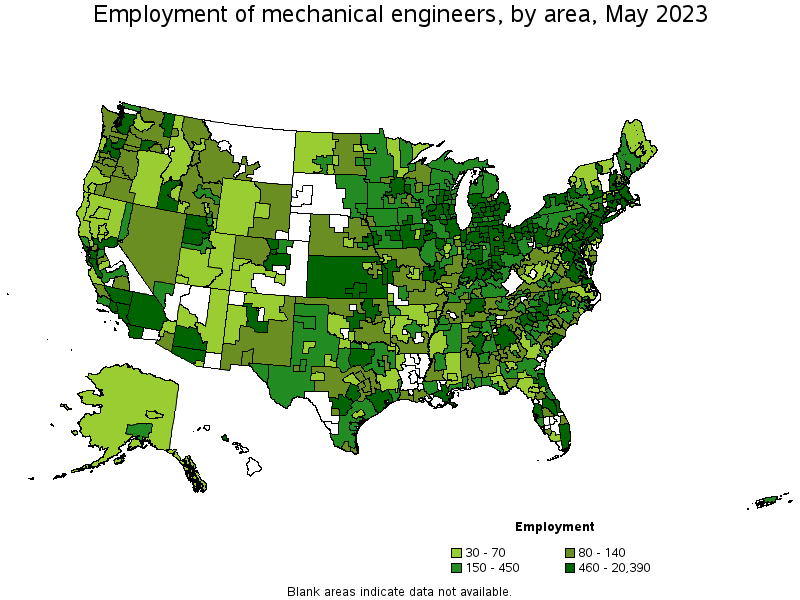
BLS map of mechanical engineer employment by metro area, May 2023, showing heavy concentration in a handful of industrial regions and minimal presence across most of the country.

Source: Bureau of Labor Statistics, OEWS May 2023. Mechanical Engineers (17-2141).

The numbers behind the map are worse than the colors suggest. Five states account for over 40 percent of every mechanical engineering job in the country. Michigan leads with a location quotient of 4.05, meaning it has four times the national average concentration of MEs. California, the largest state economy, has a location quotient below 1.0. It is actually underrepresented in mechanical engineering jobs relative to its size.

Table 1. ME Employment by Top States (May 2023 OEWS)

State ME Jobs Location Quotient % of U.S. ME Total
Michigan 32,580 4.05 11.6%
California 27,420 0.82 9.8%
Texas 19,630 0.78 7.0%
Pennsylvania 19,060 1.73 6.8%
Ohio 15,160 1.50 5.4%
Top 5 subtotal 113,850 40.5%
Remaining 45 states + D.C. ~167,000 ~59.5%
U.S. total (ME) ~281,000 100%

Source: Bureau of Labor Statistics, OEWS May 2023. SOC 17-2141. Location quotient measures local concentration relative to the national average (1.0 = average). Five states hold over 40 percent of all ME jobs.

The map gets worse when you compare it to other fields. California employs 27,420 mechanical engineers. It also employs 304,390 software developers (BLS, 2024c). That is an 11-to-1 ratio in a single state. Nationally, there are nearly six software developers for every mechanical engineer. Software and computer occupations have telework rates near 65 percent (BLS, 2023a). Mechanical engineers sit closer to 26 percent (BLS, 2023b). See Reason #30. A software developer in Boise or Raleigh or Omaha can work for a company in San Francisco without moving. You cannot test a casting from your living room. You cannot run a DV plan from a home office in a city that has no test lab, no prototype shop, and no OEM within two hundred miles. Your work is physical, your employers are clustered, and the gap between those two facts is your career.

Table 2. ME vs. Software Developer Employment, Top States (May 2023 OEWS)

State ME Jobs Software Dev Jobs Ratio (SW : ME)
California 27,420 304,390 11.1 : 1
Texas 19,630 138,510 7.1 : 1
Washington 89,110
Virginia 86,680
New York 105,460
U.S. total ~281,000 1,656,880 5.9 : 1

Source: Bureau of Labor Statistics, OEWS May 2023. ME = SOC 17-2141. Software developers = SOC 15-1252. — = state not in top 5 for ME employment; full state data available in BLS downloadable files. Washington, Virginia, and New York each employ more software developers than the top ME state (Michigan) employs mechanical engineers. California alone employs 304,390 software developers. The entire U.S. mechanical engineering workforce is roughly 281,000.

If you zoom in further, the concentration gets more extreme. The metro areas with the highest ME location quotients are not coastal cities or tech hubs. They are manufacturing corridors. Columbus, Indiana, a city built around one company, has a location quotient of 26.54. That means it has over 26 times the national average concentration of mechanical engineers. Three of the top five metros are in Michigan. These are the places where your career lives. If you are not in one of them, you are reading job boards with three results.

Table 3. Top Metro Areas for ME Concentration (May 2023 OEWS)

Metro Area ME Jobs Location Quotient Mean Wage
Columbus, IN 1,340 26.54 $117,070
California-Lexington Park, MD 680 14.48 $110,700
Waterloo-Cedar Falls, IA 1,010 11.68 $108,150
Saginaw, MI 870 10.99 $93,530
Detroit-Warren-Dearborn, MI 20,390 10.73 $102,870
Huntsville, AL 2,260 8.99 $111,780
Ann Arbor, MI 1,910 8.85 $108,980
New Bern, NC 350 7.79 $88,280
Fond du Lac, WI 300 6.69 $101,100
Bremerton-Silverdale, WA 600 6.49 $102,710

Source: Bureau of Labor Statistics, OEWS May 2023. SOC 17-2141. Sorted by location quotient. Columbus, IN (Cummins headquarters) has over 26 times the national average concentration of MEs. Outside of Detroit, the highest-concentration metros employ fewer than 2,300 mechanical engineers each. These are not cities you dream of moving to. They are cities where one employer decides whether your career exists.

Outside the top ten states, the remaining 120,000 or so mechanical engineering jobs are scattered across forty states, territories, and the District of Columbia. In many of those states, the entire ME workforce is measured in the low hundreds. In some states, the entire mechanical engineering workforce is smaller than the accounting department at a mid-size company. If you live in one of those states and want to stay, your options are not limited. They are functionally zero. The job that exists is the job you take, on the terms it offers, because there is no second offer coming from across town.

This is why the advice to "just relocate" misses the point. You can relocate. Many do. But you are not relocating to a city. You are relocating to a plant, or a cluster of plants, in a region you did not choose, for a program that may not outlive your mortgage. See Reason #20. Look at Table 3 again. Outside of Detroit, the highest-concentration metros each employ fewer than 2,300 MEs. Saginaw has 870. Fond du Lac has 300. You are not moving to a labor market. You are moving to a plant. And when that program ends, you do not get to search locally. You search the map again, the same short list of metros with the same short list of employers, and you ask your family to move again.

The map has always looked like this. Nobody shows it to you before you declare the major.


References:

Bureau of Labor Statistics. (2023a, December 19). About 1 in 3 workers in management, professional, and related occupations teleworked in November 2023. The Economics Daily. https://www.bls.gov/opub/ted/2023/about-1-in-3-workers-in-management-professional-and-related-occupations-teleworked-november-2023.htm

Bureau of Labor Statistics. (2023b). Occupational requirements survey: Mechanical engineers. https://www.bls.gov/ors/factsheet/mechanical-engineers.htm

Bureau of Labor Statistics. (2024a). Occupational employment and wage statistics, May 2023: Mechanical engineers (17-2141). https://www.bls.gov/oes/2023/may/oes172141.htm

Bureau of Labor Statistics. (2024b). Occupational employment and wage statistics, May 2023: District of Columbia. https://www.bls.gov/oes/2023/may/oes_dc.htm

Bureau of Labor Statistics. (2024c). Occupational employment and wage statistics, May 2023: Software developers (15-1252). https://www.bls.gov/oes/2023/may/oes151252.htm

Aerial view of Hashima Island, an abandoned industrial settlement surrounded by open ocean, its concrete buildings decaying with no inhabitants remaining.

Reason #73: You're the Last to Know When the Program Dies

You submitted the ECO on Friday. Revision D of the intake manifold bracket, with the updated tolerance stack and the supplier's adjusted tool path. You had been working that change for three weeks through routing, review, and two rounds of comments from quality. On Monday you badge in and the program is dead.

Nobody called you over the weekend. The email went out at 4:47 PM Friday from a VP two levels above your director, addressed to a distribution list you are not on. By the time you sit down, your coworkers already know. Someone saw it on Teams. Someone heard it from a supply chain manager who heard it from purchasing. You are the last to find out because you were doing the work. You were a line item on someone else's cost sheet. See Reason #23.

The DV test plan you spent two months writing will never run. See Reason #36. The fixtures you speced are in a quote cycle that purchasing will cancel before lunch. The PPAP package you assembled documents a part that will never be produced. The supplier you spent six months qualifying will move on to someone else's program or close the file entirely. None of this was failing. All of it was on schedule. The program was killed for reasons that had nothing to do with engineering. See Reason #72. Portfolio rebalancing. A revised market forecast. A bet on a different platform that someone in strategy liked better. The decision was made in a room full of people who do not know what a tolerance stack is and do not need to.

This is not rare. In automotive, programs get killed mid-cycle regularly. In defense, contract phases are descoped or shelved after years of preliminary design review. In consumer products, a product line gets cut because retail shelf commitments shifted. In industrial equipment, a next-generation platform gets frozen indefinitely because the installed base is "good enough." In this line of work, you do not control whether anything you build leaves the building. The common thread is that engineers find out last and absorb the cost first. You were the most invested person in the building. You were also the least informed.

What happens next depends on how your employer accounts for the loss. You get reassigned to a program that is already staffed and does not need you. You sit on sustaining work and minor ECOs while management figures out where to bill your hours. Or the cancellation becomes a restructuring and you are part of the reduction. In every scenario, the months or years you poured into the dead program collapse into a single resume line about a product nobody outside your old building has heard of, on a platform that no longer exists, for a market someone in another time zone decided not to enter.

You did everything right. The program did not care.


A lioness lunging from dense brush at a fleeing impala that only just realized the ambush was already underway.


March 14, 2026

Reason #72: The System Works Exactly as Designed (Just Not for You)

You have been reading this blog and thinking something is broken. The oversupply, the pay compression, the credential treadmill, the churn. It looks like a system failing its people. It is not failing. It is working. Every piece is doing exactly what it was built to do. The problem is that none of it was built for you. See Reason #60.

Start with the universities. They do not cap enrollment because enrollment is revenue. Mechanical engineering is the most popular engineering major in the country, which means it is the most profitable pipeline to keep open. See Reason #4. Every undecided freshman who defaults into ME is a tuition-paying seat for five or six years. See Reason #1. The department does not ask whether the market can absorb the graduates. The department asks whether the lecture hall is full. It is. The department is working as designed.

ABET accredits the programs. It does not limit them. It audits syllabi and faculty credentials and capstone rubrics. It does not restrict the number of seats, does not lobby for title protection, does not enforce scope of practice, and does not intervene when the graduate-to-opening ratio reaches two and a half to one. See Reason #13 and See Reason #34. Its job is to certify quality, not to manage supply. It certifies. The pipeline fills. ABET is working as designed.

Employers benefit next. A permanent buyer's market means they can post "entry-level" with three years of required experience and still fill the seat. They can run six-month temp-to-perm auditions and call it due diligence. See Reason #45. They can hold raises to 3% because ten qualified replacements will accept the same number tomorrow. They can classify you as overhead and budget you accordingly. See Reason #23. The surplus is not a problem for them. It is a procurement advantage. Hiring is working as designed.

Staffing firms sit in the middle and profit from the churn. Every contract placement, every temp extension, every conversion fee is a transaction that only exists because the pipeline keeps refilling and companies keep hedging. The more volatile the hiring cycle, the more valuable the middleman. Staffing is working as designed.

The professional societies collect dues, host conferences, and publish journals. They do not negotiate pay floors, restrict entry, or enforce title protection the way the AMA or the ABA do. ASME will sell you a membership and a networking lunch. It will not stand between you and the employer who just cut your team by 40%. See Reason #13. The society is working as designed. It was designed to be a trade association, not a guild.

The party line holds it together. See Reason #39. Recruiting pages publish reassurance. Outreach organizations push the pipeline forward. When enough doubt accumulates, someone writes a "debunking myths" article to steady the next cohort. See Reason #59. The messaging is working as designed. Its job is not to inform you. Its job is to keep you walking forward.

Now step back and look at the whole machine. Universities profit from your tuition. ABET profits from accreditation fees. Employers profit from your replaceability. Staffing firms profit from your churn. Societies profit from your dues. The outreach apparatus profits from your optimism. At every stage, a stakeholder extracts value from the surplus, and at no stage does any stakeholder have an incentive to reduce it. The oversupply is not a market failure. It is the market. You are not a participant in this system. You are the input.

This is why so many reasons on this blog can all be true at the same time without anyone fixing any of them. The people who could intervene, the universities, the accreditors, the professional bodies, are the same people who benefit from the status quo. The employers who complain about "talent shortages" are the same employers who offshore junior work, refuse to train, and post fifteen-year experience requirements for roles they gutted a decade ago. See Reason #25 and See Reason #55. Nobody is confused. Everybody is comfortable. The only person absorbing the cost is you.

You thought the system was supposed to serve you. It serves itself. You are the subsidy it runs on.


Dozens of pigs packed shoulder to shoulder in an industrial feeding pen, one looking up through a metal divider while the rest face the trough with no room to turn.

March 11, 2026

Reason #63: One in Five of You Will Work Without Using the Degree

You picked mechanical engineering because it sounded broad. Flexible. The one that keeps your options open. That reputation is the entire sales pitch, and it collapses the moment you compare ME to the other engineering disciplines on any measure that actually matters. See Reason #8.

The Federal Reserve Bank of New York tracks labor market outcomes for recent college graduates by major every year, drawing from the U.S. Census Bureau's American Community Survey. The data cover unemployment, underemployment, and median wages for graduates ages 22 to 27, broken out across more than seventy fields of study. Across six years of data, from roughly 2019 through 2024, a pattern holds without exception: among the named engineering disciplines, mechanical engineering pays less and places worse than nearly all of them. Table 1 lays it out. In 2024, ME's early-career median wage was $80,000. Computer engineering paid $90,000. Aerospace and chemical engineering both paid $85,000. Industrial paid $83,000. Electrical paid $82,000. Only civil engineering, at $75,000, paid less. By mid-career the gap widens. Chemical engineering hits $135,000. Computer engineering, $131,000. Aerospace, $130,000. ME sits at $120,000. Still second to last. A chemical engineer earns $15,000 more per year at the same career stage, doing work of comparable difficulty, with a comparable unemployment rate. Over a twenty-year mid-career window, that is $300,000 in lost earnings before you account for compounding.

Table 1. Median Wages by Engineering Major, 2024 (Ages 22-27 and 35-45)

Major Early Career Mid-Career ME Deficit (Mid)
Computer Engineering $90,000 $131,000 -$11,000
Chemical Engineering $85,000 $135,000 -$15,000
Aerospace Engineering $85,000 $130,000 -$10,000
Industrial Engineering $83,000 $100,000 +$20,000
Electrical Engineering $82,000 $123,000 -$3,000
Mechanical Engineering $80,000 $120,000
Civil Engineering $75,000 $115,000 +$5,000

Source: Federal Reserve Bank of New York, The Labor Market for Recent College Graduates, February 2026 (2024 ACS data).

The underemployment numbers are worse, and they do not move. Underemployment, in the New York Fed's definition, means working in a job that does not typically require a bachelor's degree. For ME, that rate has hovered between 15.8 and 21.3 percent across every year the Fed has published this data. One in five ME graduates, year after year, ends up in a job that did not need the degree. That is not a blip. It is structural. Table 2 ranks the engineering disciplines by underemployment. In 2024, ME's rate was 20.1 percent. Aerospace was 14.7. Civil was 15.6. Computer engineering was 15.8. Chemical was 17.9. ME was worse than all of them. The only engineering categories with consistently higher underemployment are the vague ones: general engineering, miscellaneous engineering, and engineering technologies. The categories that exist because someone could not or did not specialize.

Table 2. Underemployment Rate by Engineering Major, 2024

Major Underemployment Unemployment
Aerospace Engineering 14.7% 2.2%
Civil Engineering 15.6% 2.3%
Computer Engineering 15.8% 7.8%
Chemical Engineering 17.9% 4.7%
Mechanical Engineering 20.1% 4.4%
Electrical Engineering 21.1% 3.2%
General Engineering 31.1% 4.5%
Miscellaneous Engineering 26.4% 3.7%

Source: Federal Reserve Bank of New York, The Labor Market for Recent College Graduates, February 2026 (2024 ACS data). Underemployment = share working in jobs that typically do not require a bachelor's degree. Italicized rows are non-specific/catch-all categories.

That last point deserves a second look. The "Swiss Army knife" argument says ME's breadth is an asset. If that were true, you would expect ME graduates to land degree-required jobs at a higher rate than graduates in narrower fields. The data say the opposite. Aerospace engineers study a tighter curriculum and have lower underemployment. Chemical engineers cover fewer domains and get placed more often. The breadth does not help you land a job. It helps employers slot you into whatever opening they cannot fill with someone who actually specialized. You become the fallback candidate, not the first choice. And because this is not a one-year anomaly, Table 3 shows ME's numbers across six consecutive years of ACS data. The numbers shift slightly. The ranking does not.

Table 3. Mechanical Engineering Underemployment, 2019-2024

ACS Year Underemployment Unemployment Early Career Mid-Career
~2019 21.3% 3.7% $65,000 $100,000
2020 19.4% 4.4% $68,000 $104,000
2021 15.8% 5.3% $70,000 $105,000
2022 20.3% 1.5% $70,000 $111,000
2023 19.4% 1.5% $75,000 $115,000
2024 20.1% 4.4% $80,000 $120,000

Source: Federal Reserve Bank of New York, The Labor Market for Recent College Graduates, annual releases 2020-2026. Historical data recovered from Internet Archive (Wayback Machine) snapshots. One in five ME graduates works a job that does not require a bachelor's degree. This has not changed in six years.

The 2021 dip to 15.8 percent was a COVID-era labor shortage. Employers were hiring anyone with a pulse and a degree. It snapped back to 20.3 percent the following year and has stayed there. The wage growth from $65,000 to $80,000 over six years looks like progress until you measure it against inflation. The Consumer Price Index rose roughly 25 percent over the same window. In real terms, ME early-career pay is flat or declining.

Nobody who has this data in front of them picks ME over chemical, electrical, civil, computer, or aerospace engineering. The coursework is comparably difficult. The time to degree is the same. The difference is what happens after. You graduate into a market that pays you less, places you worse, and treats your "versatility" as a discount rather than a premium. The other engineers are not just happier (see Reason #38). They are better compensated for the same years of effort, by every measure the Federal Reserve tracks.


References:

Federal Reserve Bank of New York. (2019-2024). The labor market for recent college graduates. https://www.newyorkfed.org/research/college-labor-market


A single bird perched on power lines against a gray sky, still while the wires stretch empty in every direction

January 29, 2026

Reason #60: No Matter What They Tell You, There Are Winners, and You Aren’t One

In a buyer's market, the buyer keeps the surplus. That is not a controversial claim in economics. The controversy is when it happens to you. Mechanical engineering is a buyer's market. It has been one for over a decade. See Reason #1. The question is not whether there are winners and losers. The question is who sits on which side of the table, and by how much.

Start with the wage distribution. The Bureau of Labor Statistics publishes what MEs earn at every point in the curve. At the 10th percentile, you make $68,740. At the median, $102,320. At the 90th percentile, the ceiling for a full-career ME in an optimistic outcome, you make $161,240. That ceiling is second-lowest among the major engineering branches. A chemical engineer at the 90th percentile earns $182,150, twenty thousand more per year than the best-compensated ME. An aerospace engineer at the 90th percentile earns $188,910. An electrical engineer earns $172,050 (BLS, 2024). The winners in those fields win bigger. The winners in ME win less, off a lower floor, into a flatter curve. See Reason #18 and Reason #27.

Now look at who does win. The universities collect approximately two billion dollars a year in undergraduate ME tuition at public institutions alone, before graduate enrollment, before fees, and before the differential tuition premium that 56 percent of public research universities now charge specifically for engineering (ASEE, 2024; Hemelt, Stange, Furquim, Simon, & Sawyer, 2022). That revenue arrives whether or not the graduate finds a mechanical engineering job. The university is not selling you an outcome. It is selling you a seat. See Reason #72.

The staffing firms capture the churn. Engineering temporary staffing revenue reached $2.1 billion in 2023 (Staffing Industry Analysts, 2024). Every contract extension, every conversion fee, every six-month "temp-to-perm" audition is a transaction that exists because the pipeline keeps refilling and employers keep hedging. See Reason #45. The more volatile the cycle, the more valuable the middleman. The middleman is working as designed. See Reason #72.

The biggest ME employers make this visible. Engineering services firms, the single largest employer of MEs at 58,810 positions, sell your hours to someone else's program at a 40 to 60 percent markup over your pay rate (BLS, 2024; ASA, 2020). See Reason #45. Manufacturers keep you on staff to absorb the physical remainder that software cannot wave away. Government and defense primes employ another 13,610 MEs in the federal workforce and 11,160 in aerospace manufacturing, and their work follows a different logic entirely (BLS, 2024). Political scientists call it the iron triangle: Congress appropriates, the agency contracts, and the contractor delivers (Adams, 1981). The engineer is the labor input that makes the deliverables exist. The Government Accountability Office has documented for two decades that this structure provides "little incentive for contractors to utilize the best systems engineering" practices (GAO, 2008). The Defense Acquisition University's own journal reported that earned value management compliance has "supplanted" engineering judgment, converting design work into schedule metrics and signoff artifacts (Abba, 2017). A Congressionally mandated review panel called the result "an outdated, industrial-era bureaucracy" (Section 809 Panel, 2018). You turn appropriations into schedules. You turn schedules into signoffs. You are told to be grateful for the stability, and the stability is real: federal engineers stay a median of 6.5 years, nearly double the private-sector median of 3.5 (BLS, 2024). But the Congressional Budget Office found that workers with advanced degrees receive lower total compensation in federal service than private-sector counterparts (CBO, 2024). You trade ceiling for floor. See Reason #39.

The employers capture the rest, and the mechanism is now documented in peer-reviewed labor economics. Azar, Marinescu, and Steinbaum found that moving from the 25th to the 75th percentile in labor market concentration is associated with a 17 percent decline in posted wages (Azar, Marinescu, & Steinbaum, 2022). A 2024 BLS study using employer-level data confirmed that a shift from unconcentrated to highly concentrated markets is associated with a 6.8 percent decrease in average wages (Thompson, 2024). Benmelech, Bergman, and Kim, using Census manufacturing plant data spanning 1977 to 2009, found that employer concentration in manufacturing has been increasing for four decades, and that the negative relationship between concentration and wages strengthens over time (Benmelech, Bergman, & Kim, 2022). ME works in manufacturing. ME works in plant towns where three employers control the labor market. See Reason #74. The oversupply gives employers a 2.5-to-1 candidate ratio. The geographic concentration gives them monopsony pricing power. The two mechanisms reinforce each other, and the surplus they extract is not a theory. It is a wage line that sits below every peer discipline except civil.

The outcome distribution tells the rest of the story. There are 1,014,000 people in the United States whose highest degree is in mechanical engineering. Only 293,100 work as mechanical engineers (NSF, 2023; BLS, 2024). That is 29 percent. Another 238,000 work entirely outside science and engineering. The remaining are scattered across adjacent technical roles, management, sales, or out of the labor force entirely. See Reason #63. For the 23 percent in non-S&E occupations, the cost of the mismatch is not just the lost identity. It is a measurable wage penalty. Cassidy, using NSCG data, found that the penalty for occupation-education mismatch increased 56 percent between 1993 and 2019 (Cassidy, 2023). The mismatch is getting more expensive, not less, and ME has one of the largest mismatched populations in engineering by absolute count.

There are winners in this market. The university collects two billion in tuition. The staffing firm collects two billion in placements. The employer pays 17 percent less than a competitive market would require. The professional society collects dues and runs conferences. See Reason #13. At every stage, a stakeholder extracts value from the surplus. At no stage does the engineer.

You are not a participant in this market. You are the margin it runs on.


References:

Abba, W. (2017). The evolution of earned value management. Defense AT&L, March-April 2017. https://www.dau.edu/library/damag/march-april2017/defense-atandl-march-april-2017-2-evolution-earn

Adams, G. (1981). The politics of defense contracting: The iron triangle. Council on Economic Priorities.

American Society for Engineering Education. (2024). Engineering and engineering technology by the numbers, 2023. https://ira.asee.org/by-the-numbers/

American Staffing Association. (2020). When clients ask: What goes into your bill rate? ASA Fact Sheet.

Azar, J., Marinescu, I., & Steinbaum, M. (2022). Labor market concentration. Journal of Human Resources, 57(S), S167-S199. https://doi.org/10.3368/jhr.monopsony.1218-9914R1

Benmelech, E., Bergman, N. K., & Kim, H. (2022). Strong employers and weak employees: How does employer concentration affect wages? Journal of Human Resources, 57(S), S200-S250.

Bureau of Labor Statistics. (2024). Employee tenure in 2024. https://www.bls.gov/news.release/tenure.nr0.htm

Bureau of Labor Statistics. (2024). Occupational employment and wage statistics, May 2024: Mechanical engineers (17-2141). https://www.bls.gov/oes/current/oes172141.htm

Cassidy, H. (2023). The increasing penalty to occupation-education mismatch. Economic Inquiry. https://doi.org/10.1111/ecin.13192

Congressional Budget Office. (2024). Comparing the compensation of federal and private-sector employees in 2022. https://www.cbo.gov/publication/60235

Government Accountability Office. (2008). Best practices: Increased focus on requirements and oversight needed to improve DOD's acquisition environment and weapon system quality (GAO-08-294). https://www.gao.gov/assets/a271836.html

Hemelt, S. W., Stange, K. M., Furquim, F., Simon, A., & Sawyer, A. (2022). Major differences: Variation in undergraduate earnings by field of study. Education Next, 22(2).

National Science Foundation. (2023). National Survey of College Graduates, 2021 (NSF 23-306), Table 1-1. https://ncses.nsf.gov/pubs/nsf23306

Section 809 Panel. (2018). Report of the Advisory Panel on Streamlining and Codifying Acquisition Regulations, Volume 1. https://discover.dtic.mil/section-809-panel/

Staffing Industry Analysts. (2024). US staffing 2023-2024: Temporary trends. https://static1.squarespace.com/static/5df75b994c1bf307fe492432/t/66b4f350a195031156bc6271/1723134810773/US-Staffing-2023-2024-Temporary-TrendsPGC-GROUP.pdf

Thompson, D. (2024). Measuring labor market concentration using the QCEW. Monthly Labor Review, October 2024. https://www.bls.gov/opub/mlr/2024/article/measuring-labor-market-concentration-using-the-qcew.htm

Tall wooden totem with painted mask, standing in fallen leaves, layers piled like a hierarchy.

January 28, 2026

Reason #59: If Everything Was Fine, They Would Not Need to Debunk It

You click a page titled "Debunking Myths: Why Mechanical Engineering Is Not Bad" and it reads like a defense brief wearing a guidance counselor's smile. The point is not the optimism. The point is that someone felt compelled to publish optimism in the first place. Nobody writes "it's not bad" unless they are hearing "it's getting bad" often enough to worry about the pipeline (see Reason #1).

Search for "debunking myths" and any other major engineering branch. Try electrical. The results are about physical safety: volts versus amps, whether rubber gloves protect you, what happens when you touch a downed power line. Try computer science. The results are about accessibility: you do not need to be a genius, you do not need a four-year degree, women belong here too. Try civil. You get articles about whether engineers are all introverts. None of these fields have a professional outreach organization publishing an article titled "Why [Our Discipline] Is Not Bad." The myths other fields debunk are personality stereotypes and technical misconceptions. The myths mechanical engineering debunks are about whether the career itself is viable. That distinction is the signal.

DiscoverE is not a random commenter. It is the outreach infrastructure of the engineering profession, the organization behind Engineers Week, Future City, Girl Day, and the classroom toolkits that universities, companies, and museums reuse to sell engineering as upbeat, necessary, and attainable. It funds pipeline programs through corporate partners and coalition relationships. And the article lives on DiscoveringEngineering.org, "your gateway to the wonders of engineering," a name and slogan designed to function as the official front door for anyone choosing a major (see Reason #25). When that machinery publishes career reassurance for one specific discipline, it is not a random editorial decision. It is a diagnostic.

Look at the "myths" DiscoverE chooses to fight: limited job options and boring work. The response is the highlight reel: renewables, robotics, space, medical devices, "more in demand than ever." Compare that to what the federal data actually shows. The BLS projects 18,100 annual openings against roughly 30,000 new graduates per year. The Federal Reserve Bank of New York reports that 20.1 percent of recent mechanical engineering graduates are underemployed, the worst rate among major engineering branches (see Reason #63). A peer-reviewed study of 1,061 mechanical engineering seniors found their career intentions were shaped by perceptions of creative opportunity, not labor market data (Magarian and Seering, 2021). The brochure's "myths" are not myths. They are observations that the data confirms, repackaged as misconceptions so the institution can correct you instead of correcting itself. You already know how the reporting methodology makes this possible (see Reason #39).

The financial incentive is structural. Engineering students pay differential tuition premiums at 56 percent of public research universities (Hemelt et al., 2022). Mechanical engineering is the largest branch by enrollment. ABET accredits 323 programs and caps none of them (see Reason #13). Every program page needs the highlight reel because every program needs the seats filled. The reassurance is not a favor. It is a line item.

A naysayer will tell you every field has its cheerleaders. That is true. But the cheerleading tells you something. Computer science does not need DiscoverE to publish "why CS is not bad" because the median CS salary is $136,620 and the underemployment rate is 12.2 percent. Civil engineering does not need it because the PE maps directly to employment. The fields that require institutional reassurance are the fields whose numbers cannot do the reassuring on their own. If the data were convincing, the article would not exist. You are not reading a rebuttal. You are reading a recruitment ad dressed as one.

The pattern does not stop at the classroom door. In March 2026, Apollo Technical, a staffing firm that places mechanical engineers for a living, published a 3,000-word article titled "Is a Mechanical Engineer a Good Career in 2026?" It cited the same BLS projection, the same 18,100 openings figure, and the same median salary. It did not mention that universities produce over 30,000 mechanical engineering graduates a year. It acknowledged that the best income jumps come from leaving mechanical engineering for product management, systems engineering, or technical sales, and framed that as a selling point (see Reason #28). A recruiting firm whose revenue depends on a full pipeline felt the need to reassure you the pipeline is healthy.

The institution does not publish reassurance when everything is fine. It publishes reassurance when it needs you to keep walking forward anyway.

References

Bradshaw, R. (2026, March 19). Is a mechanical engineer a good career in 2026? Apollo Technical. https://www.apollotechnical.com/is-a-mechanical-engineer-a-good-career/

DiscoverE. (n.d.). About DiscoverE. https://discovere.org/about/

DiscoverEngineering. (n.d.). Debunking myths: Why mechanical engineering is not bad. https://www.discoverengineering.org/debunking-myths-why-mechanical-engineering-is-not-bad/

Hemelt, S. W., Stange, K. M., Furquim, F., Simon, A., & Sawyer, A. (2022). Why is math cheaper than English? Understanding cost differences in higher education. Journal of Labor Economics, 40(4), 831-880. https://doi.org/10.1086/709535

Magarian, J. N., & Seering, W. (2021). From engineering school to careers: An examination of occupational intentions of mechanical engineering students. Engineering Management Journal, 33(1), 31-55. https://doi.org/10.1080/10429247.2020.1860414

Empty atrium walkways with stark sun shadows, like a pipeline built for foot traffic.

January 27, 2026

Reason #57: The Entry Ramp Is Built for People With No Life

You think the hard part is the coursework. It’s not. The hard part is fitting the shape the hiring pipeline was built around. Of course Mechanical engineering doesn't “discriminate by age” so much as it selects for the conditions that usually come with being young: unencumbered, available, and cheap. The moment you show up with a mortgage, a spouse, a kid or two, a second job, or even just a spine, the path narrows to a slit. The field is already crowded, and the one bridge into the first real role is the internship bottleneck. See how that’s going in Reason #5.

And the internships that do exist are rarely where your life is. They are in plant towns, two time zones away, on schedules that start before sunrise, doing sustaining work no one wants to staff year-round. “Relocation friendly” sounds like a perk until you realize it means you are expected to uproot yourself for three months to earn the right to apply for a job that still calls itself entry-level. If you cannot pick up and vanish for a summer, your résumé is treated as a character flaw. Your course projects do not count as experience, and the postings quietly confirm that. See Reason #12.

The geography is not incidental either. ME ties you to factories, and factories do not move to accommodate your daycare pickup. See Reason #20

This is why “going back for a BSME” can feel like a trap for non-traditional students. School is the only socially acceptable reset, but mechanical engineering does not reset cleanly. The gatekeepers still want the same stamps: recent grad status, internship logos, and a story that sounds like you had nothing better to do than chase a rotating series of plant badges. If you are older, you get squeezed from both sides. You can be “overqualified” for internships and still “underqualified” for engineer roles, and you get told to be patient while you bleed time. That patience is competing against an oversupplied pipeline and a hiring stack that never stops refilling, see Reason #1 and Reason #24And if you lose a year just getting to the starting line, the clock does not stop for you, see Reason #29.

A naysayer will say the entry ramp rewards hustle. It does. It also assumes you can afford an unpaid summer in a plant town you have never heard of. With 30,000 graduates entering every year and 18,100 openings to absorb them, the employers who require relocation and free labor are not making unreasonable demands. They are making the demands the supply lets them make.

Then comes the real punchline. Mechanical engineering loves to advertise itself as practical and grounded, but its hiring funnel is built for people with the least grounding. The profession that claims to reward responsibility quietly selects for people who can postpone responsibility a little longer. You will call it a career move. The system will call it an internship, and invoice you accordingly.


Backpacker pauses by a lone outdoor sink, like a career path built for constant relocation.


January 22, 2026

Reason #55: Being Needed Means Being Used (Until You’re Fired)

For a while, you will believe the place cannot run without you. You are the one who “makes it happen.” You translate vague leadership wishes into hardware that ships, you unstick the build when the pilot line stalls, you answer the questions nobody else can even parse. Then you remember the part they never say out loud. You are still replaceable. The market is still crowded. Your indispensableness does not make you unfirable. See Reason #34

Mechanical engineering is unusually good at turning you into a catch basin. Broadness gets sold as freedom, but in practice it makes you the default owner of anything that touches atoms. Demand modeling, supplier chasing, fixture triage, packaging drop test drama, “just run the numbers,” “just update the model,” “just make a quick drawing,” “just lead the meeting.” That is not leadership noticing your talent. That is the organization exploiting a job description with soft edges. See Reason #8

And because you are a cost code, not a revenue line, the gratitude is always temporary. Every new productivity hack comes with a new dashboard, a new cadence, and a new expectation that you can do two roles with one headcount. When the quarter tightens, your “range” is not rewarded. It is treated as proof you can absorb more. See Reason #23

Here is the darker part. Being the catch basin means you also become the blame basin. The more hats you wear, the more ways you can be “responsible” for something slipping. A supplier is late, a test slot is unavailable, a requirement changes, a VP wants it by Tuesday anyway. You write the memo, you own the action items, you stand in front of the slide with your name on it. In ME, visible impact is shared, but accountability sticks. See Reason #33

Those little dings add up. Missed dates you did not control. “Communication issues” when you refuse to promise miracles. “Not strategic” when you tell them physics has a schedule. Meanwhile your calendar is eaten alive by check-ins and “alignment,” which guarantees the work never gets a clean flow anyway. See Reason #42

Even your peers quietly benefit from it. If you are the fixer, everyone else gets to stay in their lane. Then review season comes and the lane-keepers look stable while you look messy. And in a field where everyone is competing for a small number of good seats, stability wins. See Reason #6

A naysayer will call indispensability a compliment. In a field with 2.5 credential holders for every working position, your indispensability is not a sign of your value. It is a sign of the organization running lean because it can (see Reason #1).

You will be proud to be depended on right up until the day they depend on you as the explanation.

White spray swallows a lighthouse as the sea hammers it, useful but not safe.


January 14, 2026

Reason #53: Your Kids Don’t Want This Career

Some careers run in families. Medicine does. Law does. Architecture does. These are licensed, gated professions with exams, boards, and formal choke points. Parents pass down not just expectations, but practical knowledge about how to get through the gate. Dynasties form because the structure rewards them.

A peer-reviewed study out of the Institute for Evaluation of Labour Market and Education Policy used a regression discontinuity design to isolate the causal effect of a parent's field of study on their children's career choices. The study tracked Swedish university applicants from 1977 to 1992 and followed their children's outcomes through 2023. The design is rigorous. It exploits admission score cutoffs to separate the effect of actually studying a field from the shared family background that might push both generations toward it. The results confirm what you would expect: children of doctors become doctors. Children of architects become architects. Children of lawyers become lawyers. The professions that carry prestige, clear career ladders, and durable earning power pass themselves forward (Table 1). Engineering overall clears the bar as well, showing a statistically significant causal inheritance effect of +98% (Altmejd, 2023).

Then there is mechanical engineering.

When the study isolates bachelor's-level engineering subfields, the pattern breaks. Fewer than half a percent of all students choose mechanical engineering. The descriptive data shows children of mechanical engineers are still drawn to the field at 220 percent of that baseline rate, meaning shared family background (math aptitude, socioeconomic class, proximity to engineering culture) pushes them toward it. But once you isolate the causal channel, the part that comes specifically from growing up watching a parent do the work, the effect reverses. Children of mechanical engineers become three times less likely to follow the same path as their parents (Table 2). Civil engineering shows a smaller negative effect. Electrical engineering is roughly flat. Mechanical engineering is the outlier. The background says go. The dinner table says don't (Altmejd, 2023, Appendix Table C.2).

The same study explains why. The paper establishes that inheritance runs through labor market outcomes. Parents who are predicted to earn well in their field pass it on. Parents who are predicted to earn below the 56th percentile cause the opposite effect: their children become less likely to follow. In other words, the study proves that weak career outcomes break the chain of inheritance. You do not need to speculate about why mechanical engineering breaks the pattern. You have seventy posts of evidence on this blog documenting exactly the labor market conditions that the study identifies as the mechanism. The underemployment is the highest among the core engineering disciplines (see Reason #63). The pay lags every peer except civil (see Reason #27). The satisfaction is the lowest (see Reason #38). The work drifts into coordination and paperwork (see Reason #9). The study did not set out to indict mechanical engineering. It simply measured what happens when parents have weak labor market prospects in their field. Mechanical engineering fit the pattern.

Children of mechanical engineers do not need career fairs or glossy brochures to understand this. They grow up watching it. They see the relocations that were not optional (see Reason #20 and Reason #11). The late nights that were not heroic. The layoffs that were not personal, just "business" (see Reason #44 and Reason #45). They notice how much of the work disappears into paperwork and how little of it turns into autonomy, flexibility, or durable upside (see Reason #33).

Engineering overall shows inheritance. Mechanical engineering shows rejection. The field has no shortage of outsiders lining up (see Reason #1 and Reason #34). What it lacks is succession. The people who know it best do not pass it on.

Data Tables

Table 1. Career Inheritance by Profession

Profession % of All Students How Often Children Follow Effect of Parent's Experience
Architecture 0.55% 729% of baseline +245%
Medicine 4.39% 354% of baseline +97% ***
Law 1.08% 343% of baseline +105%
Engineering (all disciplines) 3.30% 207% of baseline +98% ***
Teaching 5.99% 140% of baseline +31%

Source: Altmejd (2023), IFAU Working Paper 2023:11, Table B.2. "% of All Students" = baseline share of children who earn a degree in this field. "How Often Children Follow" = how much more likely children of parents in this field are to also earn a degree in it (descriptive). "Effect of Parent's Experience" = the causal effect of the parent's own enrollment, isolated from shared family background via regression discontinuity. *** p ≤ 0.001.

Table 2. Career Inheritance Within Engineering (Bachelor's Subfields)

Subfield % of All Students How Often Children Follow Effect of Parent's Experience
Engineering (all disciplines) 3.30% 207% of baseline +98% ***
BSc. Chemical Engineering 0.05% 198% of baseline +1,358%†
BSc. Civil Engineering 0.51% 259% of baseline −40%
BSc. Electrical Engineering 0.49% 144% of baseline −10%
BSc. Mechanical Engineering 0.38% 220% of baseline −290%

Source: Altmejd (2023), IFAU Working Paper 2023:11, Appendix Table C.2 (subfields) and Table B.2 (engineering overall). "BSc. Machine Engineering" in the Swedish system corresponds to mechanical engineering. †BSc. Chemical Engineering baseline is extremely small (0.05%), making the relative causal effect unstable; included for completeness.

References:

Altmejd, A. (2023). Inheritance of fields of study (IFAU Working Paper 2023:11). Institute for Evaluation of Labour Market and Education Policy. https://hdl.handle.net/10419/296956


Animated family tree where branches break off and fall away, symbolizing a career path that fails to pass to the next generation.

Reason #75: It's a Vocation Wearing a Profession's Suit

You took the same calculus sequence as the pre-med students. You took the same physics as the future physicists. You survived thermodynamics...